Demo of the PHOENIX Interactive Dashboard for Stellar Spectra
[NOTE] You’ll need to install muler for this tutorial. You can install it via pip.
In this tutorial we will see how the spectra of stars vary as a function of their intrinsic properties.
[1]:
from gollum.phoenix import PHOENIXGrid, PHOENIXSpectrum
from specutils import Spectrum1D
import pandas as pd
import astropy.units as u
import numpy as np
import matplotlib.pyplot as plt
Fetch example IGRINS data
The data was downloaded from here and here. You need both files in the same directory (in our example tutorial_data) for this to work!
[2]:
from muler.igrins import IGRINSSpectrum
[3]:
path = '../tutorial_data/SDCH_20201202_0059.spec_a0v.fits'
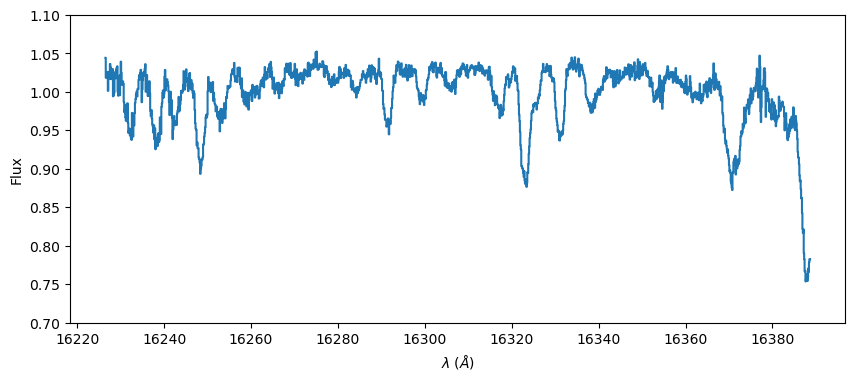
[4]:
spec = IGRINSSpectrum(file=path, order=12).normalize().remove_nans().trim_edges()
spec.plot(color=None, ylo=0.7, yhi=1.1)
plt.show()
Load the PHOENIX Grid
The online installation guide shows how to download and store the PHOENIX models.
[5]:
grid = PHOENIXGrid(teff_range=(2500, 7000), logg_range=(2, 5), Z_range=(0, 0.5), wl_lo= 16200, wl_hi= 16400)
Processing Teff=7000K|log(g)=5.00|Z=+0.5: 100%|██████████████████████████████████████████████████████████████████████████████████████████████████████████████████████████████████████████████████████████████████████████████████████████████████████████████████████████████████████████| 644/644 [00:05<00:00, 124.69it/s]
You should achieve a fairly good fit with the following parameters: Teff: 5000, log(g): 2, Metallicity: 0, Rotational Broadening: 29.3, RV: 41.95, Scale Factor: 1.06
[6]:
grid.show_dashboard(data=spec)