Quickstart
[1]:
import matplotlib.pyplot as plt

from gollum.phoenix import PHOENIXSpectrum

%config InlineBackend.figure_format='retina'
Simply provide the \(T_{\text{eff}}\) and \(\log{g}\) values you desire:
[2]:
spec = PHOENIXSpectrum(teff=5000, logg=4, download=True)
Normalize the spectrum by the median:
[3]:
normalized_spectrum = spec.normalize()
The spectrum has wavelength, with units:
[4]:
normalized_spectrum.wavelength
[4]:
$[8038,~8038.01,~8038.02,~\dots,~12848.96,~12848.98,~12849] \; \mathrm{\mathring{A}}$
The flux vector is the same length as wavelength:
[5]:
len(normalized_spectrum.flux) == len(normalized_spectrum.wavelength)
[5]:
True
[6]:
ax = normalized_spectrum.plot()
ax.set_ylim(0, 2)
plt.show()
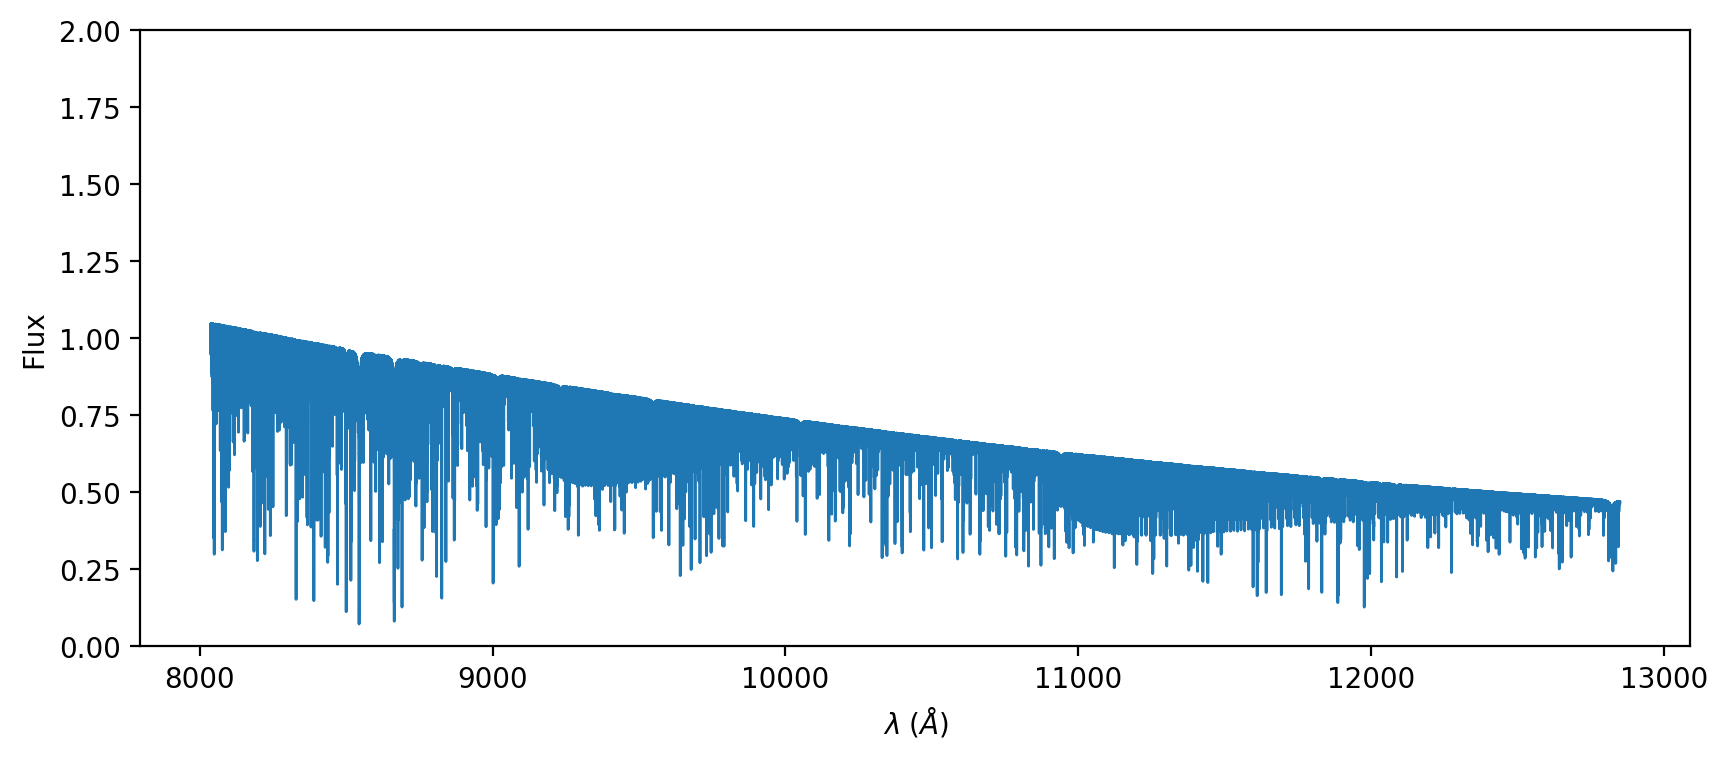
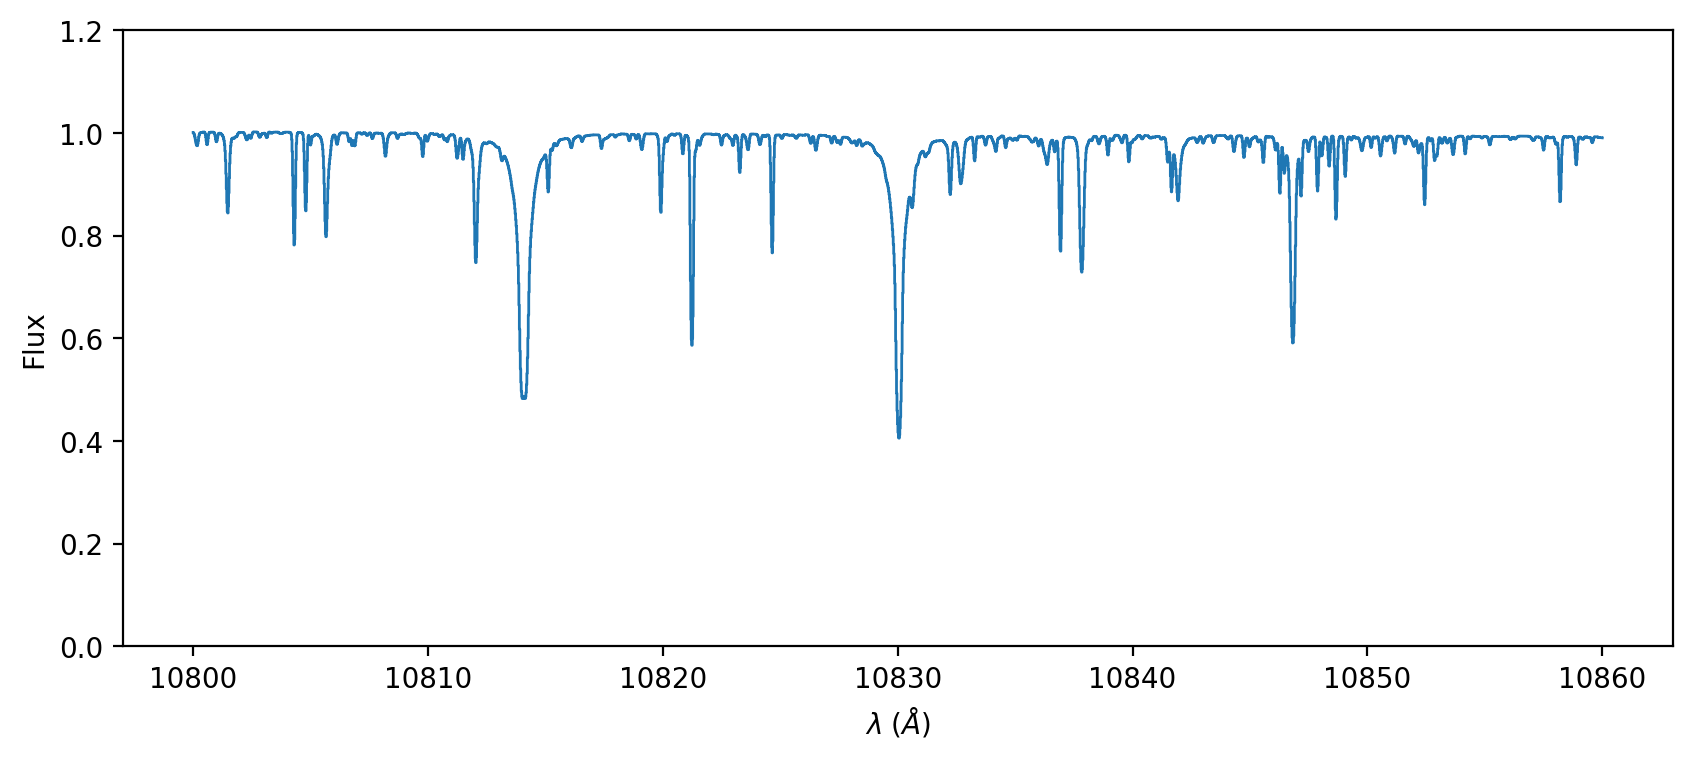
Right now we truncate the spectrum to the near-IR by default, you can change that with keyword arguments from the beginning:
[7]:
spec = PHOENIXSpectrum(teff=5000, logg=4, wl_lo=10800, wl_hi=10860, download=True)
[8]:
ax = spec.normalize().plot()
ax.set_ylim(0)
plt.show()
Neat! gollum is still under active development. Help us develop the tool by engaging with us on our GitHub Issues page. You can suggest a feature, or help us brainstorm how to build this project more. Thanks!