Working with the PHOENIX models
[1]:
from gollum.phoenix import PHOENIXSpectrum
import numpy as np
import matplotlib.pyplot as plt

%config InlineBackend.figure_format='retina'
Let’s download a PHOENIX spectrum:
[2]:
spec = PHOENIXSpectrum(teff=2800, logg=5.0, download=True)
[3]:
spec.wavelength # "Angstroms"
[3]:
$[8038,~8038.01,~8038.02,~\dots,~12848.96,~12848.98,~12849] \; \mathrm{\mathring{A}}$
[4]:
spec.flux.unit # "egs / s / cm^2 / cm"
[4]:
$\mathrm{\frac{erg}{s\,cm^{3}}}$
We can normalize the spectrum, which divides the spectrum by the median value, rendering the flux units dimensionless
[5]:
spectrum = spec.normalize()
np.median(spectrum.flux)
[5]:
$1 \; \mathrm{}$
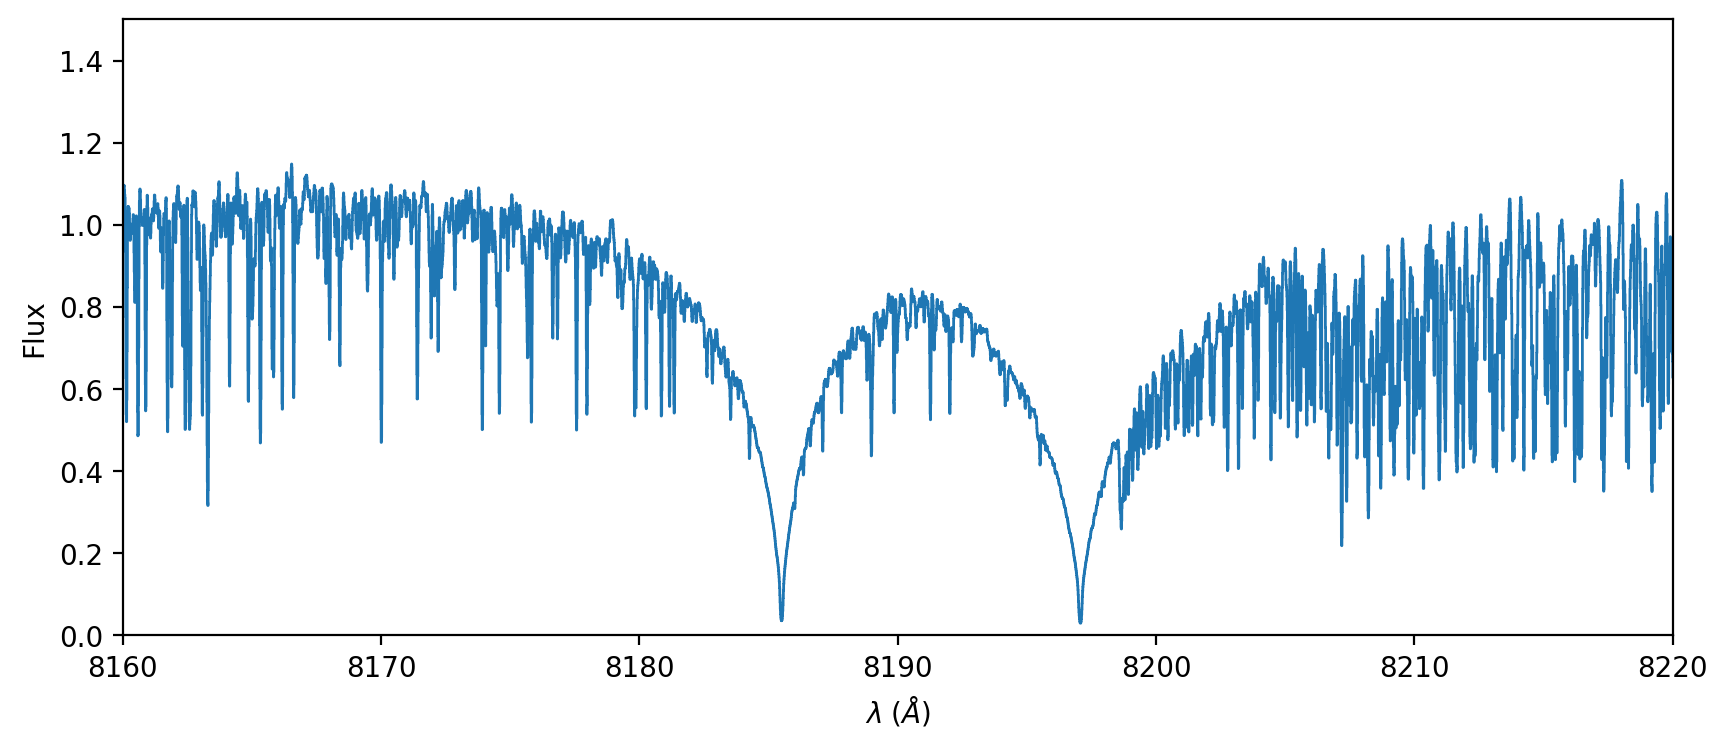
[6]:
ax = spectrum.plot()
ax.set_xlim(8160, 8220)
ax.set_ylim(0, 1.5)
plt.show()
Neat! There are many great uses for the PHOENIX models.